You may have heard of a stock chart pattern called the golden cross. It’s usually mentioned in headlines when stock markets rally after a sharp or extended sell-off. It’s a technical chart indicator that bulls view as a reversal of the preceding downtrend.
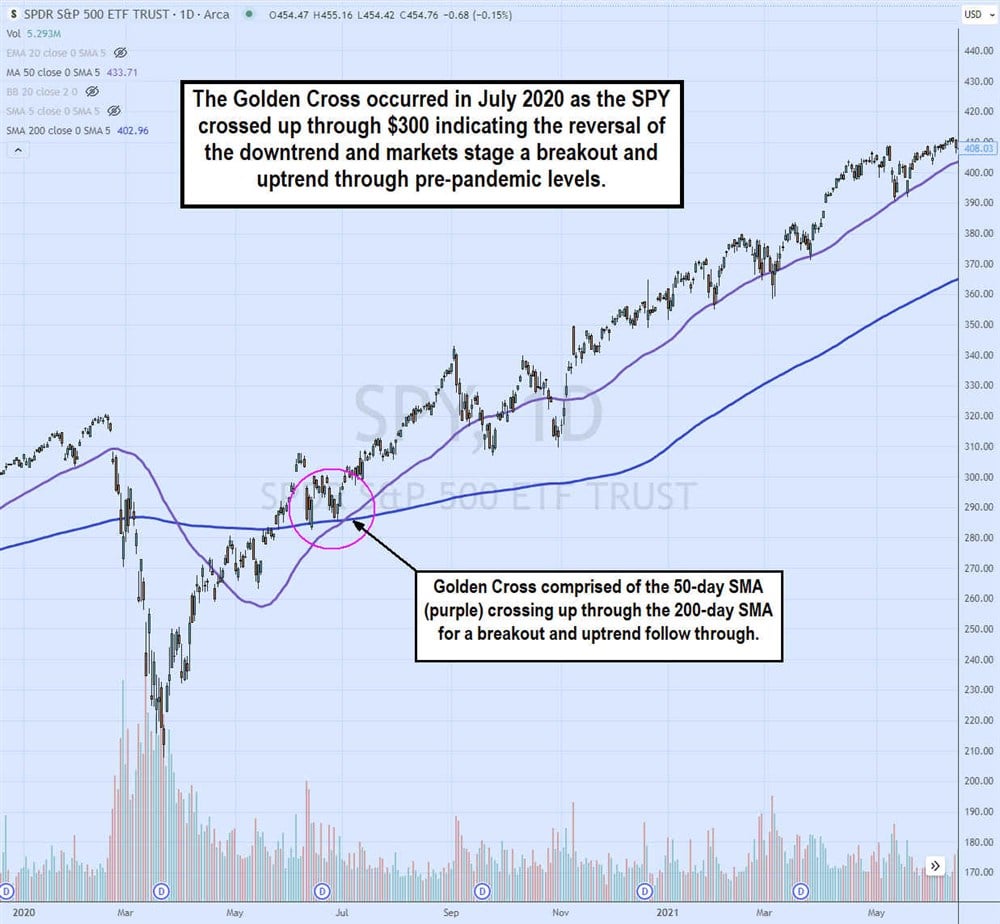
The golden cross was in the news after the stock market bottomed in March 2020 and rallied higher into the reopening of the pandemic in 2021.
The golden cross preceded the powerful rally that surged the S&P 500 up through pre-COVID-19 levels. We’ll explain golden cross patterns, nuances and how to use them for your trades.
By the end of this article, you’ll be able to identify golden cross stocks. Whether you’re an investor or trader, they can be part of your arsenal to analyze stocks for potential trades thoroughly.
What is a Golden Cross Signal?
What is a golden cross in stocks? A golden cross is a breakout chart pattern that indicates the reversal of a downtrend. The golden cross comprises a 50-period simple moving average (SMA) and a 200-period SMA.
The 50/200 is the defining characteristic of a golden cross. The 50-period SMA is the leader, and the 200-period SMA is the laggard. The period is the selected time increment such as weekly, daily, 60 minutes.
The conventional golden cross comprises a 50-day SMA performing a crossover up through the 200-day SMA.
“Day” and “period” are interchangeable as in 50-day moving average and daily 50-period moving average means the same thing. You will hear it commonly referred to using the "day" rather than "period" on TV and financial news headlines.
The term period is more convenient when dealing with intraday charts, as in the five-minute 50-period SMA, which is the same as the 50 five-minute SMA. In that case, it's much more clear calling it a five-minute 50-period SMA.
The golden cross is often used in the context of the general stock market or a benchmark index representing the general stock market. You often hear of the golden cross forming on the Dow Jones Industrial Average or the S&P 500 index. However, the golden cross occurs in stocks and other tradable financial assets.
The stock market golden cross forming on the benchmark indexes bodes well for almost all stocks. When a golden cross occurs in the indexes, they likely occur simultaneously in the stocks that comprise the index. This makes the golden cross signal on one index or stock open up the possibility of many more golden cross in stocks.
A golden cross is comprised of just two indicators. The short-term, or lead SMA, is the 50-period and the longer-term, or laggard SMA, is the 200-period. You can use many variations when it comes to the moving averages as long as they are the 50-period and the 200-period.
Some traders may prefer exponential moving averages (EMA) as they can give an earlier signal since recent trade prices carry more weight than older prices.
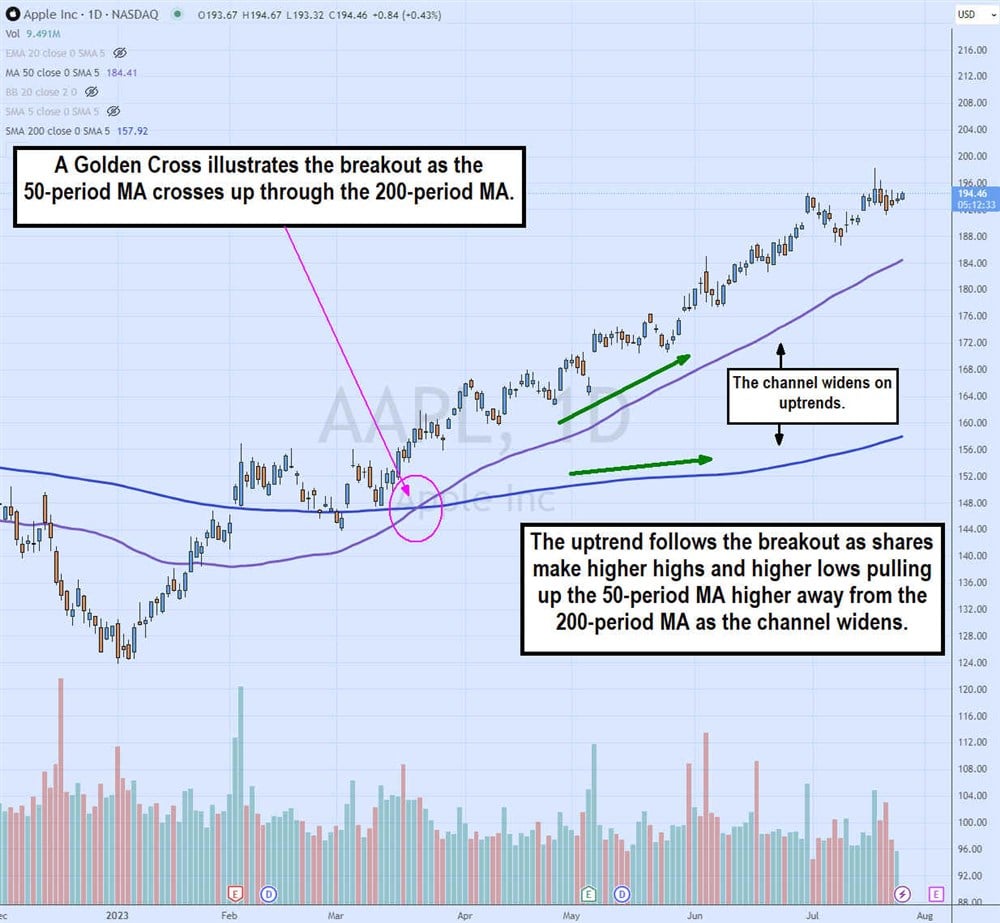
The golden cross forms when the 50-period MA crosses up and through the 200-period MA. The golden crossover indicates that a breakout occurs when it turns into an uptrend as the 50-period MA rises and starts pulling up the 200-period MA, which also rises slower.
The distance between the 50-period SMA and the 200-period MA is the trading channel and initially gets wider as the stock continues to make higher highs and higher lows on the uptrend.
The channel tightens when the stock starts slowing down. This means the 50-period MA starts to flatten as the 200-period MA catches up. From here, either another leg of the uptrend forms as the 50-period MA rises again or the 50-period MA turns and crosses the 200-period MA down, forming a breakdown.
How to Identify a Golden Cross Signal
Here are some ways to identify and confirm a golden cross signal or identify a stock golden cross.
Moving Averages to Identify a Golden Cross
The moving average crossover as the 50-period MA crosses up through the 200-period MA is the clearest sign of a golden cross. This breakout is the best way to identify a golden cross. It also presents two levels of price support moving forward.
The 50-period MA is the first support, and the 200-period MA is the second and final support level. A rising 50-period MA is needed to confirm the breakout and subsequent uptrend.
Technical Indicators to Identify a Golden Cross
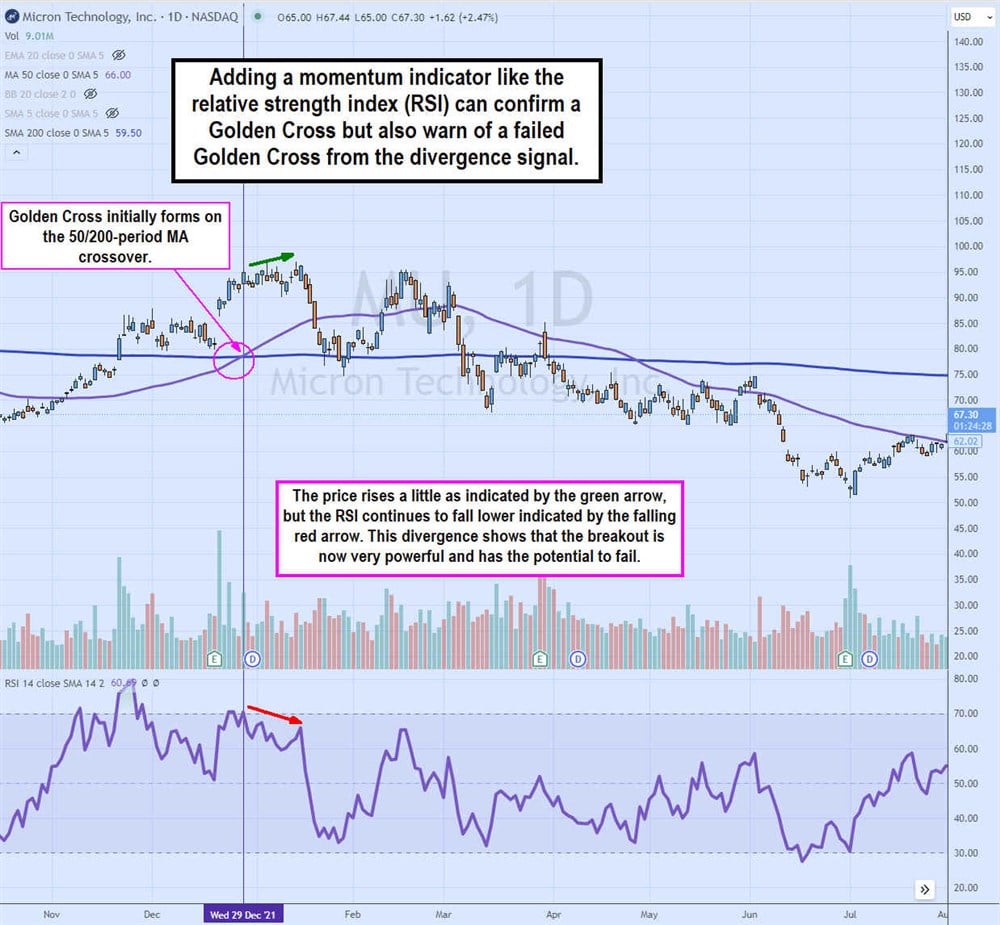
Sometimes you can get head fakes or false breakouts on initial golden cross patterns. This can happen with the 50-period MA initially crossing up through the 200-period MA but then fizzling and falling back down again.
You can add momentum indicators to the chart to confirm the breakout. A momentum indicator like the relative strength index (RSI) will confirm the breakout by rising towards the 70-band. If the RSI fails to rise back up when the golden cross forms, it's considered a divergence signal that could result in a breakdown.
Train your eyes to identify what is a golden cross in the stock market.
Example of a Golden Cross
Let's look at an example of what is a golden cross in stock with Amazon.com Inc. (NASDAQ: AMZN).
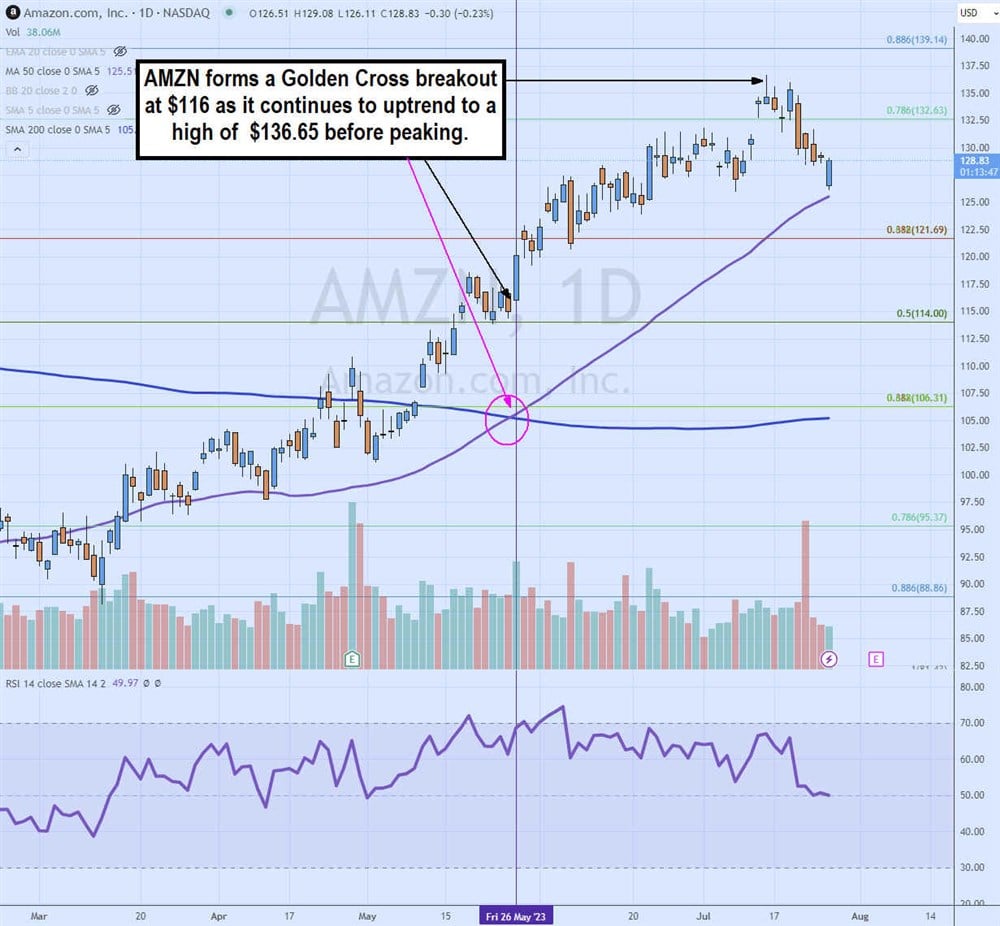
The 50-period MA in purple crosses through the 200-period SMA in blue as AMZN bounces up through $116. This is the breakout. AMZN makes higher highs and higher lows on pullbacks.
This lifts the 50-period MA higher as it uptrends. This, in turn, pulls the 200-period MA higher gradually. The channel between the 50-period MA and the 200-period MA continues to widen as the uptrend continues to rise.
The AMZN uptrend peaks at a high of $136.65 before prices dip down to $126.32.
How to Identify Golden Crosses on a Chart
Here are the steps to identify a Golden Cross pattern on a chart.
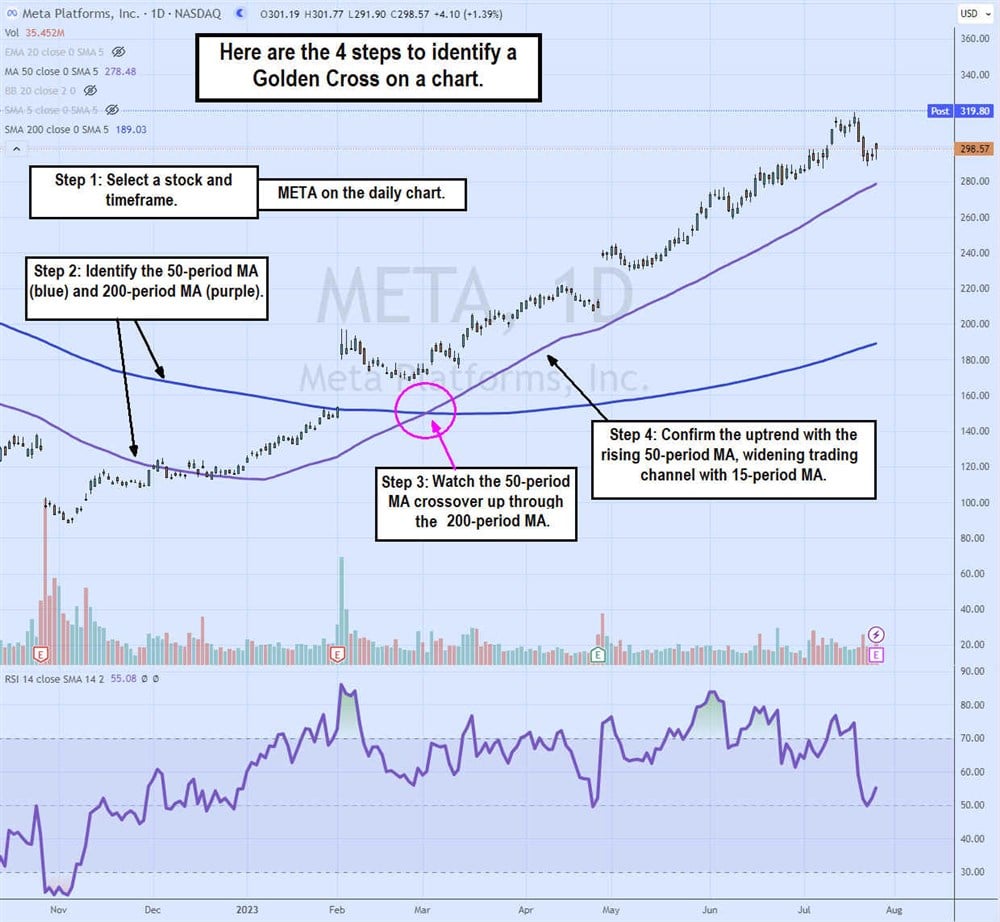
Step 1: Select a stock and timeframe.
First and foremost, you have to select a stock. It can be anything from a penny stock to a dividend stock to a blue chip stock. It helps if the stock has a volume preferably over 100,000 shares average daily trading volume. In the above example, we chose Meta Platforms Inc. (NASDAQ: META) stock and the daily timeframe on a candlestick chart.
Step 2: Find the 50/200 moving averages.
A golden cross requires a 50-period moving average and a 200-period moving average. They are illustrated on the META daily chart by the 50-period MA line in purple and 200-period MA line in blue.
The purple line is the lead MA, and the blue line is the laggard MA, which means the purple line (50-period MA) will always react first and then be followed by the 200-period MA.
The 50-period MA is the first line of support, followed by the second support as the 200-period MA.
Step 3: Watch for the 50-period and 200-period MA crossover.
The 50-period MA starts below the 200-period MA at the beginning of the daily chart on the left side. This indicates that META was in a downtrend. Notice how the 50-period MA stopped falling around the $120 price level and then started to rise toward the 200-period MA.
The 50-period MA crosses up through the 200-period MA $171 as the relative strength index (RSI) oscillator bounces up to the 70-band.
Step 4: Confirm the trend with a rising 50-period MA.
After the breakout through $170, META continued to climb higher, making higher highs on bounces and higher lows on pullbacks. This causes the 50-period MA to rise. As it rises, the channel between the 50-period MA and the 200-period MA gets wider as the 50-period MA rises father away from the 200-period MA.
The RSI is also rising and maintains at or above the 70-band.
Pros and Cons of Golden Cross Stocks
Here are the good and not-so-good things to know about golden cross stocks.
Pros
The benefits of answering "What is golden cross in stocks?" include the following:
- Bullish chart pattern: The golden cross is a much-loved stock pattern by investors since they are long the stock. You would be relieved if you've suffered a downtrend and it finally turns back up. The golden cross is akin to the calvary coming to the rescue.
- Easy to identify: The golden cross is a relatively easy pattern since it only comprises two moving averages and a simple trigger. It's easily identified on a chart by the crossover of the 50-period MA through the 200-period MA.
- Easy to apply: The golden cross pattern can be applied to any stock or trading instrument. It can also be applied to any timeframe. However, it is worth noting that wider timeframes carry more weight due to having more data points. Wider timeframes provide a smoother golden cross with sturdier supports, but shorter timeframes provide an earlier golden cross trigger signal.
Cons
Here are the negatives about golden cross stocks.
- Lagging and late signal: The biggest argument about golden cross stocks is that a 50-period and a 200-period MA take so much time to get a signal that, often, it's considered a lagging signal. In the example of the META chart, we can observe META bouncing from a low of $88.41 to $171.43 before the golden cross forms. The stock more than doubled before triggering the golden cross signal. However, the stock rose to $318.68 before it peaked. Supporters will argue that the wider periods enable the golden cross pattern to smooth out the noise. There is a way to get an earlier signal on the golden cross by utilizing shorter time frames, which we will cover shortly.
- False breakouts: A stock can trigger a golden cross breakout only to fizzle and break down again. This was the case in the example with MU stock. It did trigger a breakout at $91 as it immediately sold off to $75 before another bounce up to $95.50, and it fizzled into a breakdown as the 50-period MA crossed over down through the 50-period MA at $67. Golden crosses can be responsible for expensive entries that result in losses as the breakout fizzles and sells off.
- Market conditions apply: The overall context of the stock market ultimately determines how strong a golden cross can be. If the market takes an abrupt downturn, it can cause golden cross formations to fizzle out and even reverse into a breakdown. Therefore, it's crucial to keep abreast of macro market conditions if taking a position using the golden cross indicator.
Try Smaller Timeframes for an Earlier Signal
You can use smaller timeframes for an earlier signal to address one of the major complaints about the pattern being a lagging indicator. Like a Doppler radar effect, the wider timeframes provide the general landscape, but a shorter timeframe, like an intraday 60-minute or 15-minute timeframe, provides a much earlier signal.
The caveat is that there will be more false signals and general "noise" when you use shorter time frames. This can be balanced by adding additional price indicators like Bollinger Bands to gauge price expansion or compression stages and momentum indicators like the relative strength index (RSI) to time entries.
FAQs
Here are answers to some frequently asked questions.
Is a golden cross good in stocks?
A golden cross is a bullish breakout signal, which is good for long positions. If you are holding a long position in a stock that triggered a golden cross, then you can gain from the impending uptrend.
The golden cross chart indicates the reversal of a downtrend and the creation and continuation of a new uptrend. If you are short-selling, it’s usually a sign to cover your short position. As you get more acclimated, you can look for golden cross stocks today routinely.
How do you use golden cross stocks?
The golden cross is a trend reversal indicator signaling a downtrend's end and an uptrend's start. You can use the golden cross as a potential buy signal when it returns to the 50-period MA or the 200-period MA. It's important to avoid chasing the golden cross signal as it may be relatively expensive when it signals.
It helps to add other price and momentum indicators when using this trading strategy.
Is golden cross trading profitable?
A golden cross trading strategy can be profitable depending on your entry and, most importantly, your exit. First, it's important to learn "What is a gold cross in stocks?" and "What does a golden cross mean in stocks?"It's best to have a trading or investing strategy. Use the golden cross as a breakout and uptrend signal with other indicators for confirmation and buy and sell triggers.